Institution Models
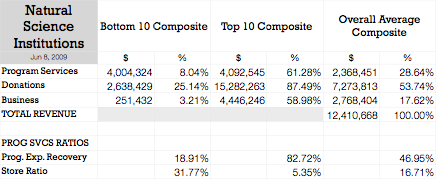
average well above the median of $3.4 million, the point at which there are as many above as below. Not so rich after all.
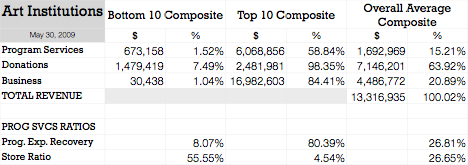
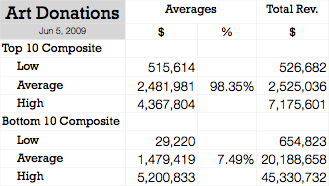
Similarly, it is not very insightful to observe that the percentage from Donations is similar for the Top 10 and Bottom 10 (56% and 53% respectively). Although numerically true, it masks the fact that the range in the Top 10, the individual institutions range from 4% to 94%, but in the Bottom 10 the lower limit is 45%. Any conclusion drawn from the averages is demolished by the disparities. Further, changing the sample size from 10 to 15 changes the figures substantially. In fact, dependence on Donations varies widely throughout the types of institutions and revenue size spectra.
The financial figures on the Performance, Sustainability, and Balance pages provide a glimpse into the financial state of over 1,000 Cultural, Arts, and Natural Science institutionss (CANs). Looking one level deeper, one can gain insight into their operations and begin to see opportunities for improving financial security and sustainability.
For each of the three income categories: Program Services, Donors, and Business, models of the Top and Bottom 10 performers in each institution category are presented that demonstrate a range of financial performance. The figures for the Top and Bottom institutions are combined to synthesize composites. An Overall Average provides a reference. A more complete view, identifying particular opportunitines using exampless of success is available in the ‘State of the Arts’ report.


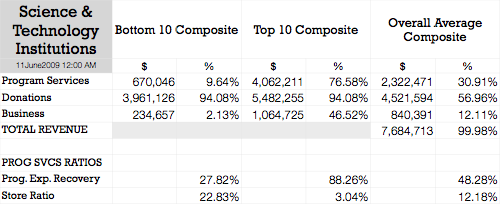
SCIENCE AND TECHNOLOGY INSTITUTIONS
The Science and Technology institutions financial performance is more similar to that of Natural History than Art institutions. They receive 31% of revenue from Program Services compared to 15% for Arts, and cover 48% of their program costs with PS revenue as compared to Arts’ 27%. They are more engaged with their public and, in return, the public directly pays relatively more for the services.
For comparison, other statistics are:
All three categories are similar in that they rely on 54% to 64% of revenue from Donations. The 15% to 31% of revenue from Program Services for the three categories, identifies a common opportunity -- increase public response and revenue from Program Services, thus spreading revenue over a larger number of individuals, creating a statistically more stable revenue source.
Science and Technology institutions have an additional opportunity. The SciTechs convert only 12% of their Program Services traffic into Store sales, compared with 27% for Arts and 17% for Natural Science.
THE NONEXISTANT AVERAGE
The models described above are useful in identifying issues and opportunities. But they should not be understood to describe institutions, or groups of them, because no average institution exists. Each is a product history, individual interests, and chance.
Because of their diversity, different slices through their financial figures produce different, even conflicting results. One might conclude from average revenue of $13.4 million for the 303 Arts institutions, for example, that they are a rich as well as famous bunch. But a few very large institutions increase the