Sustainability — Arts Institutions

--Top Business Earners --
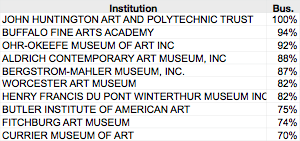
The revenue from funds, investments, financial ventures, and commerical activities such as stores and royalties constitute a business activity. The top 10, generally large and well-endowed, obtain an average of 84% of their income from Business sources, $17 million annually on average. 6 of the 10 are on the East Coast; 4 Central; 0 on new money West. In the 2007 fiscal year, by far the largest component is gains from sale of securities, with 3 obtaining more than $10 million, but this source can be volitile.
--Bottom Business Earners --
The bottom 10 only obtain an average of 1% from Business sources, obtaining 86% from Donations, and the remaining 13% from Program Services.
The overall average for 304 institutions is 21%.
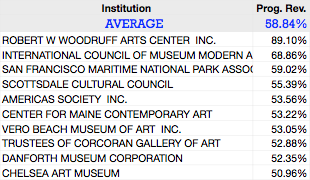
--Top Program Services Earners --
The top 10 art museums average 59% of total revenue from Program Services. The level of income ranges from $301 thousand to $17 million indicating that size is not a prime determinant of the ability to earn PS revenue. At least as important as the level of PC revenue, the Top 10’s revenue covers 80% of Program Expense. 8 of the 10 are East Coast, 2 West. Even though the income is disbursed over a wide audience, overall economic factors can affect revenue.
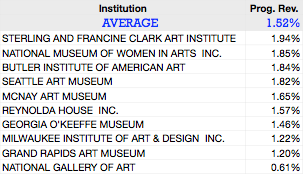
--Bottom Program Services Earners --
The bottom 10 obtain only 2% of their revenue from Program Services, averaging $673 thousand. Worse, that revenue covers only 8% of Program Expense.
The overall average for 303 institutions, large and small, is 15.2 % This means that the dominant force concerning the institution’s survivability lies outside the organization, mostly with Donors.
Program Services
Money is the root of all -- institutional survival. Of course, management, public relations, expertise, facilities, location and collections matter. But their contribution is necessarily measured by revenue because, to remain open, payments must be made at the end of the month to curators, utilities, creditors, and support services.
Cultural, Arts, and Natural Science institutions discussions typically revolve around aesthetics or grand principles. They can be heated for lack of objective measures. Sound management, however, requires metrics. You manage what you measure, said Prof. Louis Lowenstein, Columbia University.
To examine how institutions make it, the charts at the right show the highest and lowest earners (as a percent of Total Revenue) in three categories: Program Services, Donations, and Business activity.
The rankings use percentages rather than $ amounts to reveal vulnerability to shifts in a single revenue source.
The three categories are a useful way of thinking about a CAN because each requires different skills, has a different culture, has different interloqutors, and is a somewhat independent activity.
Links to related areas:
-
Return to the Perspective page, and link to the Performance page containing figures on individual institutions:
Performance
-
-


-
-
Look at the balance of revenue obtained from the three sources:
-


-
Return to home page:
-


Also see the Models page for deeper analyses of financial figures.
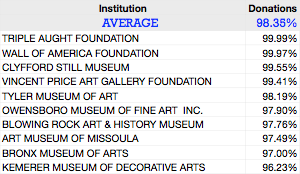
--Top Donations Earners --
These Art institutions rely very heavily on current donations, averaging $2.5 million. In spite of, or perhaps because of this, they spend only an average of 3% of the amount raised on fund raising. The high level indicates a loyal donor group, but such strong dependence on a single source leaves them fat but vulnurable.
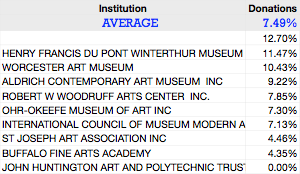
--Bottom Donations Earners --
The bottom 10 obtain only 7% of their revenue from donations, ranging from nothing to 13%, with an average of $1.5 million. These institutions are not hard up, however--they earn 70% of their revenue from Business operations. See their appearence below.
The overall average Donation percentage for 301 institutions is 64%.
Donations
Business
Top 10 in Program Service Revenue
Bottom 10 in Program Service Revenue
Bottom 10 in Donations
Top 10 in Donations
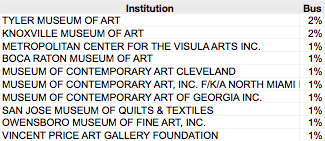
Bottom 10 in Business
Top 10 in Business
Draft 8 June 09